
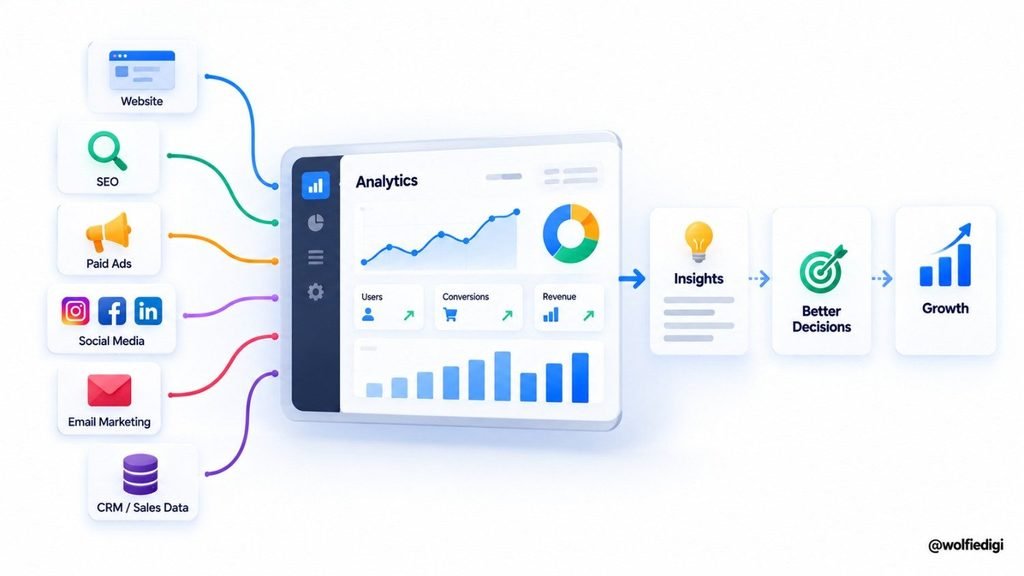
Digital marketing analytics is the process of collecting, measuring, analyzing, and interpreting data from digital marketing activities to understand what is happening, why it is happening, and what should be done next.
Every digital marketing channel produces data. A website generates traffic and engagement data. Search engines provide impressions, clicks, and queries. Paid campaigns generate advertising and conversion data. Email produces opens, clicks, and other engagement signals.
The purpose of digital marketing analytics is not to collect as many numbers as possible. It is to turn those numbers into useful insights that help marketers make better decisions, improve campaigns, and connect marketing activity with business outcomes.
What Is Digital Marketing Analytics?
Digital marketing analytics is the systematic use of data from digital marketing channels to evaluate performance and guide marketing decisions.
It can include data from:
- Websites
- Search engines
- SEO
- Paid advertising
- Social media
- Email marketing
- Content marketing
- Mobile apps
- E-commerce platforms
- Customer relationship management systems
For example, a business might discover through its analytics that organic search brings fewer visitors than social media but generates a much higher percentage of qualified leads. That information can change how the business evaluates those two channels.
This is the important distinction between data and analytics.
Data tells you what happened. Analytics helps you understand what the data means and what action may be appropriate.
What Is Digital Marketing Analytics in Simple Terms?
In simple terms, digital marketing analytics means using marketing data to make better decisions.
Imagine an online store runs three campaigns:
- A Google Ads campaign generates 1,000 visits.
- An Instagram campaign generates 2,000 visits.
- An email campaign generates 500 visits.
Looking only at traffic, Instagram appears to perform best.
But after analyzing conversions, the business discovers:
- Google Ads generated 40 purchases.
- Instagram generated 12 purchases.
- Email generated 35 purchases.
The conclusion changes.
This example shows why analytics is more than counting traffic. A useful analysis connects activity to the outcome that actually matters.
What Is the Purpose of Digital Marketing Analytics?
The main purpose of digital marketing analytics is to understand marketing performance and use that understanding to make better decisions.
It can help marketers answer questions such as:
- Which channels bring visitors to the website?
- Which channels generate leads or sales?
- Which campaigns are producing results?
- Which audiences are responding?
- Which content attracts and engages people?
- Where are users dropping out of the customer journey?
- Which marketing activities deserve more attention?
- What should be changed or tested next?
The answer will depend on the business goal.
A publisher might care about engaged readership. An e-commerce business may focus on purchases and revenue. A B2B company may care more about qualified leads and pipeline.
That is why good analytics starts with the business question, not the dashboard.
What Is the Core of Digital Marketing Analytics?
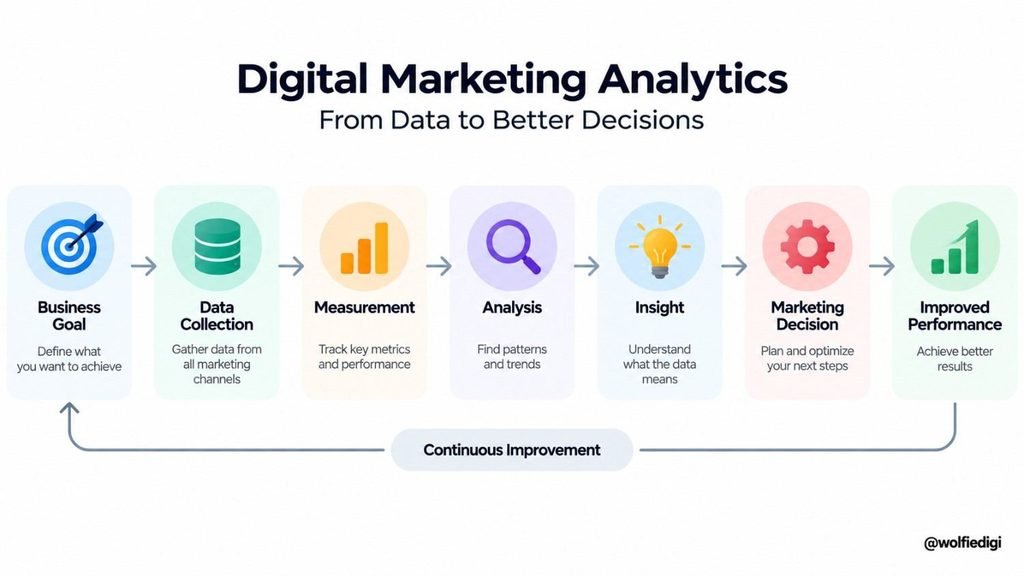
The core of digital marketing analytics is the process of turning raw marketing data into actionable insight.
A useful way to understand it is:
Goal → Data → Measurement → Analysis → Insight → Action
1. Goal
Start by deciding what the business is trying to achieve.
For example:
Increase online sales.
2. Data
Collect the information needed to understand progress toward that goal.
This could include:
- Website sessions
- Product views
- Add-to-carts
- Purchases
- Revenue
- Advertising costs
3. Measurement
Define how success will be measured.
For an e-commerce business, purchases and revenue may be more important than page views.
4. Analysis
Look for patterns, differences, trends, and relationships in the data.
For example, one advertising campaign may produce many clicks but very few purchases.
5. Insight
Turn the pattern into an explanation that can inform a decision.
The campaign may be attracting people who are interested in the topic but have low purchase intent.
6. Action
Do something with the insight.
The marketer might change the targeting, revise the ad, adjust the offer, or send visitors to a more relevant landing page.
This final step is what separates analytics from reporting.
A report can tell you that conversions fell by 15%. Analytics should help you investigate why and decide what to examine or change next.
How Does Digital Marketing Analytics Work?
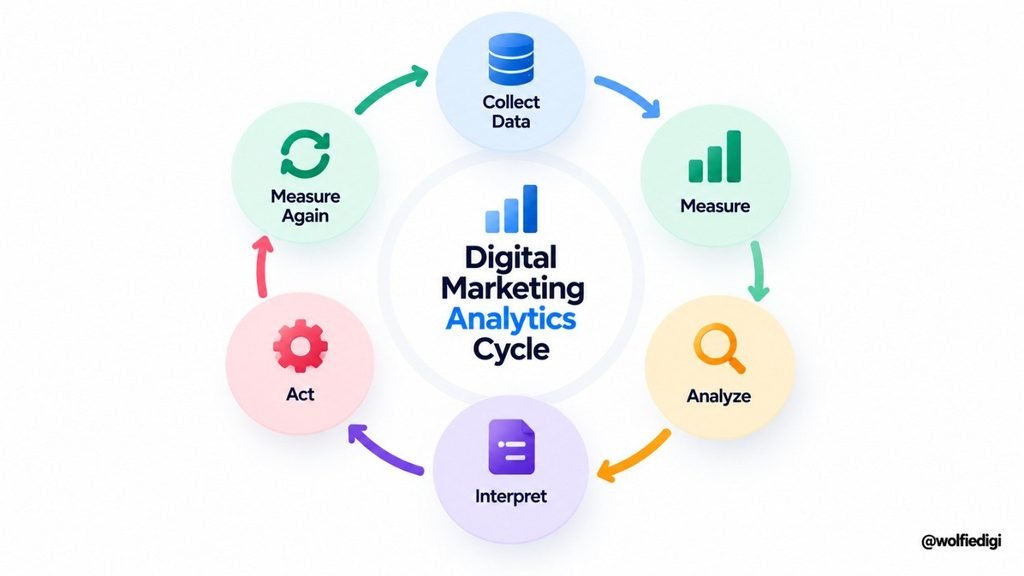
Digital marketing analytics generally follows a continuous cycle rather than a one-time process.
Collect Data
Data comes from different marketing systems and customer interactions.
For example, website analytics can capture user interactions, while advertising platforms provide campaign data and Search Console provides information about how a website performs in Google Search.
Google Analytics 4 uses events to measure interactions such as page views, clicks, and purchases.
Organize the Data
Different platforms describe similar activities in different ways.
One system might call an action a conversion, while another might record it as an event or key event. This is why marketers need consistent definitions when comparing information across platforms.
Measure Performance
The next step is examining relevant metrics.
The metrics should relate to the original objective rather than being selected simply because they are available.
Analyze Patterns
Marketers look for changes and relationships in the data.
For example:
- Traffic increased but conversions decreased.
- Paid traffic increased but cost per acquisition also increased.
- Organic impressions increased while CTR decreased.
- Email clicks increased after changing the content format.
Interpret the Results
Numbers need context.
A 20% increase in traffic might sound positive, but it means something different if sales stayed flat.
Analytics therefore requires interpretation rather than simply reading numbers from a dashboard.
Take Action
The final step is using the insight to improve the marketing activity.
The cycle then starts again.
Collect → Measure → Analyze → Interpret → Act → Measure Again
What Data Does Digital Marketing Analytics Measure?
Digital marketing analytics can measure many different types of data, depending on the channel and business objective.
Website Data
Website analytics can show:
- Users
- Traffic sources
- Page views
- Engagement
- Events
- Conversions
- Landing-page performance
- E-commerce activity
SEO Data
Search data can include:
- Impressions
- Clicks
- CTR
- Search queries
- Pages appearing in search
- Average position
Google Search Console’s Performance report provides data such as clicks, impressions, CTR, and average position, along with dimensions such as queries, pages, countries, devices, and search appearance.
Paid Advertising Data
Paid advertising platforms can provide data such as:
- Impressions
- Clicks
- Cost
- CTR
- Conversions
- Cost per conversion
- Conversion value
- Return on ad spend
Social Media Data
Social platforms can provide information about:
- Reach
- Impressions
- Engagement
- Video views
- Link clicks
- Follower growth
- Conversions
Email Data
Email marketing analytics can include:
- Deliveries
- Opens
- Clicks
- Click-through rate
- Unsubscribes
- Bounces
- Conversions
For example, a marketer may discover that one type of newsletter generates substantially more clicks than another.
If that pattern continues, it can inform future content decisions.
Customer and Revenue Data
For businesses that connect marketing data with CRM or e-commerce systems, analytics can go beyond clicks and engagement.
It can include:
- Leads
- Customers
- Revenue
- Customer acquisition cost
- Repeat purchases
- Customer lifetime value
This helps connect marketing activity to actual business outcomes.
What Are the Most Important Digital Marketing Analytics Metrics?
There is no universal list of metrics that every business should track.
The right metrics depend on the objective.
However, several categories appear frequently across digital marketing.
Traffic Metrics
These help marketers understand how many people are reaching their digital properties.
Examples include:
- Users
- Sessions
- Visits
- Page views
Engagement Metrics
These help indicate how people interact with content or websites.
Examples include:
- Engagement rate
- Time-related engagement measures
- Pages or screens viewed
- Video engagement
- Email clicks
- Social interactions
Conversion Metrics
These focus on valuable actions.
Examples include:
- Purchases
- Leads
- Sign-ups
- Downloads
- Form submissions
- Phone calls
Google Ads, for example, allows advertisers to define valuable actions such as purchases, sign-ups, and phone calls as conversions for measurement.
Cost Metrics
These help marketers understand the efficiency of paid activity.
Examples include:
- Cost per click
- Cost per lead
- Cost per acquisition
- Advertising spend
Revenue Metrics
For businesses that can connect marketing activity to revenue, useful measures can include:
- Revenue
- Revenue per customer
- Customer lifetime value
- Return on ad spend
The key principle is simple: a metric is useful when it helps answer a business or marketing question.
A dashboard containing 50 numbers is not necessarily more useful than one containing 10 well-chosen metrics.
What Are Digital Marketing Analytics Tools?
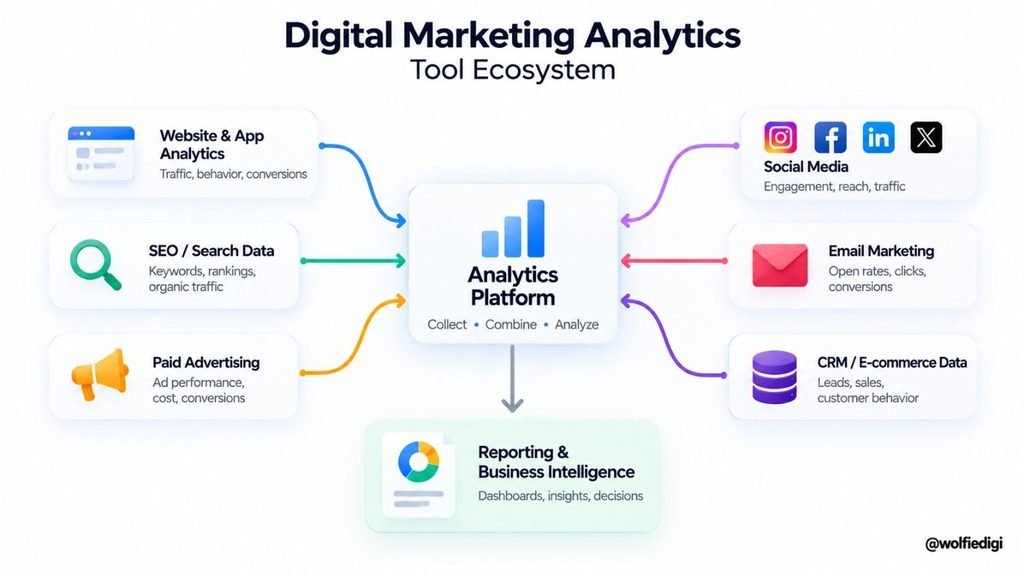
Digital marketing analytics tools are software platforms that collect, organize, visualize, or analyze data from digital marketing activities.
Different tools solve different problems.
Google Analytics 4
Google Analytics 4 is primarily used to understand how users interact with websites and apps.
It can help marketers analyze traffic, user behavior, events, conversions, and other performance information. Its current reporting system includes real-time activity, reports, explorations, and insights.
Google Search Console
Google Search Console focuses on a website’s performance in Google Search.
It can show search queries, clicks, impressions, CTR, average position, pages, countries, devices, and other search-performance dimensions.
Google Ads
Google Ads provides performance and conversion data for paid advertising.
Its conversion measurement can help advertisers understand which campaigns, ads, ad groups, and keywords are driving valuable customer actions.
Social Media Analytics
Platforms such as Meta, LinkedIn, TikTok, and YouTube provide their own analytics environments.
These tools can help marketers understand how content and campaigns perform within each platform.
Email Marketing Platforms
Email platforms provide campaign-level data such as deliveries, opens, clicks, unsubscribes, and conversions.
SEO Analytics Tools
SEO platforms can help marketers analyze search visibility, keywords, backlinks, competitors, technical issues, and content performance.
Business Intelligence and Reporting Tools
BI and visualization tools can combine information from multiple sources to create dashboards and reports.
The important point is that no single analytics tool necessarily contains every piece of marketing data a business needs.
A modern analytics setup may involve several platforms connected together.
What Is Data Analysis in Digital Marketing?
Data analysis in digital marketing means examining marketing data to find patterns, relationships, changes, and opportunities that can support decisions.
Suppose a website receives 10,000 visitors in one month and 200 purchases.
The raw numbers tell you the traffic and purchase totals.
Analysis asks deeper questions:
- Which channels brought the visitors?
- Which channels generated the purchases?
- Which landing pages converted?
- Which audience segments purchased?
- Where did users leave?
- Did performance change compared with the previous month?
- Did an advertising or content change affect the result?
This is why data analysis is different from data collection.
Collection gives you the information. Analysis helps you understand what that information means.
What Is Cross-Channel Digital Marketing Analytics?
Customers rarely interact with a business through only one channel.
Someone might:
- Discover a brand through Google Search.
- Read a blog post.
- Watch a social media video.
- Join an email list.
- Return through an email.
- Click a paid advertisement.
- Purchase later.
If each channel is analysed separately, the business may struggle to understand the complete journey.
Cross-channel analytics attempts to connect data from multiple channels so marketers can see how those interactions work together.
This does not mean every customer journey can be perfectly reconstructed. Tracking limitations, privacy choices, platform differences, and inconsistent data definitions can make cross-channel analysis difficult.
Still, the goal is valuable: understand marketing as a connected system rather than a collection of isolated channels.
Why Does Attribution Matter in Digital Marketing Analytics?
Attribution is the process of assigning credit for a conversion to one or more marketing touchpoints.
Imagine a customer discovers a business through organic search, later clicks an email, and finally converts through a paid advertisement.
Which channel gets credit?
Different attribution approaches can produce different answers.
This matters because attribution can influence how marketers interpret channel performance and make budget decisions.
However, attribution should not be treated as a perfect representation of reality. Customer journeys can involve many interactions, and tracking systems cannot always observe every touchpoint.
For a beginner, the important lesson is simply this:
Do not assume that the channel receiving the final click created all of the demand that led to the conversion.
What Makes Digital Marketing Analytics Difficult?
Having data does not automatically produce good analytics.
Too Many Metrics
Digital platforms make it easy to collect hundreds of measurements.
The challenge is deciding which ones actually matter.
Poor Tracking
If important events are not tracked correctly, the resulting analysis can be misleading.
For example, if purchases are not recorded correctly, a marketer may conclude that a campaign is failing when the real problem is measurement.
Data Inconsistency
Different platforms may report the same customer journey differently.
One platform may count an interaction differently from another, which can create apparent discrepancies.
Focusing on Vanity Metrics
Metrics such as impressions, followers, or clicks can be useful, but they do not automatically indicate business success.
A campaign with thousands of clicks and no meaningful conversions may need a different interpretation from one with fewer clicks but strong revenue.
Looking at Data Without Context
A number rarely explains itself.
Seasonality, promotions, changes in pricing, algorithm updates, tracking changes, and external events can all affect marketing data.
Good analysis considers the context surrounding the numbers.
How Can a Beginner Start With Digital Marketing Analytics?
You do not need a complicated analytics stack to begin.
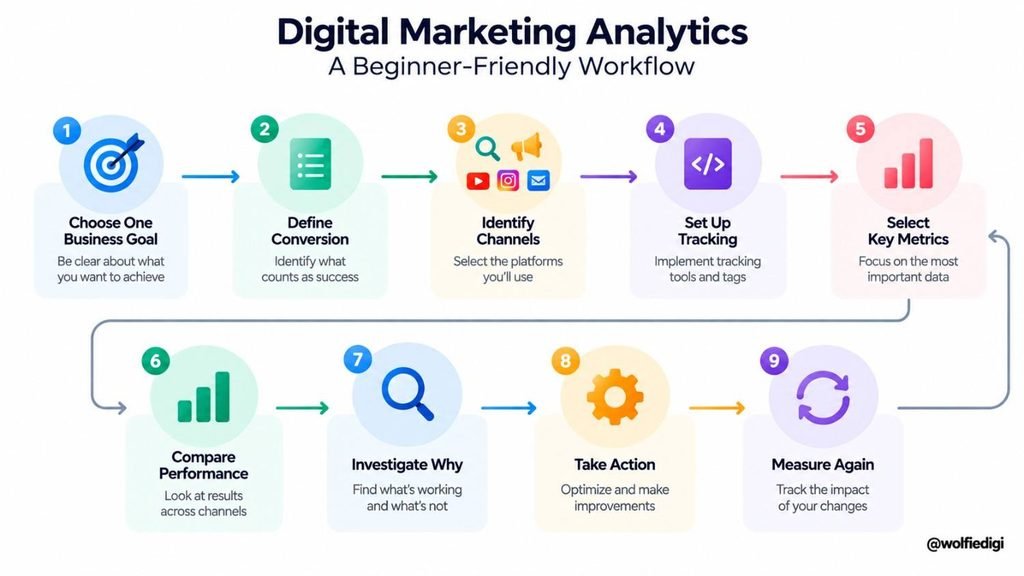
A practical starting process is:
1. Start With One Business Goal
Choose something specific.
For example:
Increase qualified leads from organic search.
2. Define the Main Conversion
Decide what action represents success.
That might be a form submission, purchase, booking, phone call, or sign-up.
3. Identify the Relevant Channels
Determine which marketing channels contribute to that goal.
For organic leads, this could include SEO, content, website analytics, and CRM data.
4. Set Up Reliable Tracking
Make sure important interactions are measured correctly.
Without reliable tracking, more advanced analysis will not fix the underlying data problem.
5. Choose a Small Set of Metrics
Select metrics that help answer your original question.
Do not start with every metric available in your analytics platform.
6. Compare Performance Over Time
Look for meaningful changes rather than reacting to every daily fluctuation.
Comparisons can include:
- Month over month
- Year over year
- Campaign versus campaign
- Channel versus channel
- Landing page versus landing page
7. Ask Why
This is where analytics becomes useful.
If conversions dropped, investigate why.
If one channel improved, investigate what changed.
If traffic increased without revenue growth, investigate the quality and intent of that traffic.
8. Take Action and Measure Again
Make a change based on the insight, then measure what happens.
Analytics is an ongoing improvement cycle, not a report that gets created once a month and forgotten.
What Is the Difference Between Digital Marketing Analytics and Reporting?
Reporting and analytics are related, but they are not the same thing.
Reporting focuses mainly on presenting what happened.
For example:
Website traffic increased 18% this month.
Analytics goes further:
Website traffic increased 18%, primarily from organic search, but conversions fell because traffic to high-intent product pages decreased.
The first statement describes a result.
The second begins to explain the result and points toward a possible decision.
This distinction matters because a polished dashboard is not automatically an analytical system.
The real value comes from using the information to understand performance and decide what to do next.
How Is AI Changing Digital Marketing Analytics?
AI is increasingly being used to help marketers work with large amounts of marketing data.
Modern analytics workflows can use AI for tasks such as:
- Detecting unusual changes
- Summarizing reports
- Identifying patterns
- Generating questions for investigation
- Forecasting certain outcomes
- Helping marketers explore large datasets
Google Analytics already provides automated and custom insights within its reporting environment.
But AI does not remove the need for good measurement.
If the underlying tracking is incomplete, inconsistent, or based on the wrong business objective, an AI-generated explanation can still be misleading.
The marketer’s role therefore remains important: define the right question, validate the data, interpret the result, and decide what action makes sense.
Final Thoughts
Digital marketing analytics is the process of turning data from digital marketing activities into useful information for decision-making.
It covers far more than website traffic. It can bring together data from SEO, paid advertising, social media, email, content, websites, apps, CRM systems, and other digital channels.
The most important part is not collecting the largest possible amount of data. It is creating a clear connection between business goals, measurement, analysis, insight, and action.
Once you understand that process, analytics becomes much easier to approach. Instead of asking only, “What happened?”, you can start asking better questions: Why did it happen, what does it mean, and what should we do next?